The ActiveEconomyReport
A data-driven summary and analysis of 21 community projects located in Beaver and Allegheny Counties, Pennsylvania
For ten years, 21 community projects have been steadily growing an Active Economy throughout Beaver and Allegheny Counties.
Research from the University of Pittsburgh shows that together these projects are projected to produce $845 million in Gross Regional Product, $123 million in social value, and 6,640 job-years.
What Is the Active Economy?
In the Active Economy, a community activates its own economic potential through project clusters designed to reinforce one another.
In the Active Economy, a community activates its own economic potential through project clusters designed to reinforce one another. An Active Economy is intentionally created by and for the community to generate wealth that stays local.
An Active Economy is intentionally created by and for the community to generate wealth that stays local.
The Active Economy Report shows what is being built and why it matters to the future of Southwestern Pennsylvania.
But it’s only the beginning of
what's possible ...
...when communities are wisely resourced to activate our region’s full economic potential.
But it’s only the beginning of what’s possible when communities are wisely resourced to activate our region’s full economic potential.
Economic impact of the Active Economy
Researchers at the University of Pittsburgh found that the Active Economy generates significant economic and social value for the region. The project portfolio was evaluated over a 20-year time horizon (2016 to 2036).
$845M
Gross Regional Product6,640
job-years$123M
Social Return on Investment
The Key Insights
Three key insights emerged from the research. Together they support the report’s central argument: that the region has been underestimating what community-led development contributes to its economic future, and should plan, prioritize, and resource accordingly.
Comparable Value, Far Less Subsidy and Risk
Active Economy projects generate jobs at one-third of the public cost of corporate megaprojects, while producing a nine-fold return on investment and generating far less risk.
Diversification beats Boom and Bust
When single-site corporate projects collapse, they take jobs and wealth with them. Diversified Active Economy clusters create resilience, promote community ownership, and circulate more money locally.
Social Value adds to Economic Value
As demonstrated across eleven measured pathways, for every $1,000 of economic impact generated by the Active Economy, an additional $143 of social value is created for local communities.

Economic Impact Over Time
Researchers at the University of Pittsburgh measured the economic and social impact of the Active Economy Portfolio using three standard metrics: Job-Years, Gross Regional Product, and Social Return on Investment. A 20-year time horizon was considered, ranging from 2016 to 2036.
6,640
Job-Years of employment supported by the
Active Economy Portfolio, past and future.
Past (Cumulative 10-year)
400Current (Annual)
82Future (One Time)
372Future (Annual)
574$845M
in Gross Regional Product generated by the
Active Economy Portfolio, past and future.
Past (Cumulative 10-year)
$50.1MCurrent (Annual)
$10.4MFuture (One Time)
$44.3MFuture (Annual)
$72.3M$123M
in social value, monetized through Social Return
on Investment analysis, past and future.
Past (Cumulative 10-year)
$23.4MCurrent (Annual)
$3.3MFuture (One Time)
$9.0MFuture (Annual)
$4.0MHow does the portfolio compare to corporate megaprojects?
Research suggests that 75% of disclosed state and local subsidy dollars go to large corporations. Due to the cost of megadeal projects, the public often assumes that such public subsidies generate an outsized return on the incentives received.
But what do the data really show?
$93M
entire portfolioBudget
Full-Time Jobs Created
projected annual, not temporaryCost per Job Created
20-Year ROI
$192
for every $100 investedSocial Value Created
Cumulative Economic Impact by Sector
The projected cluster values shown represent total GRP plus SROI over the 20-year research period.
Projects within the portfolio are strategically integrated across multiple sectors to help generate the kind of interdependence and compounding impact that is characteristic of the Active Economy.
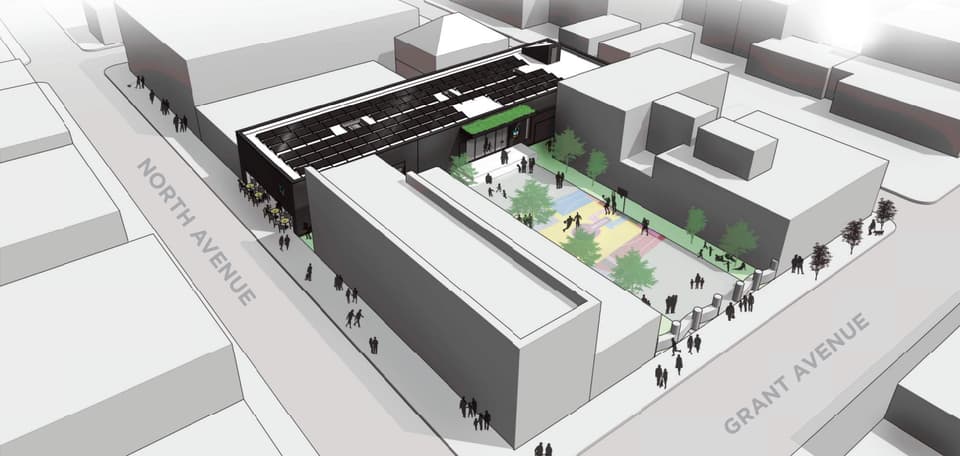 Real Estate Development$859.5M
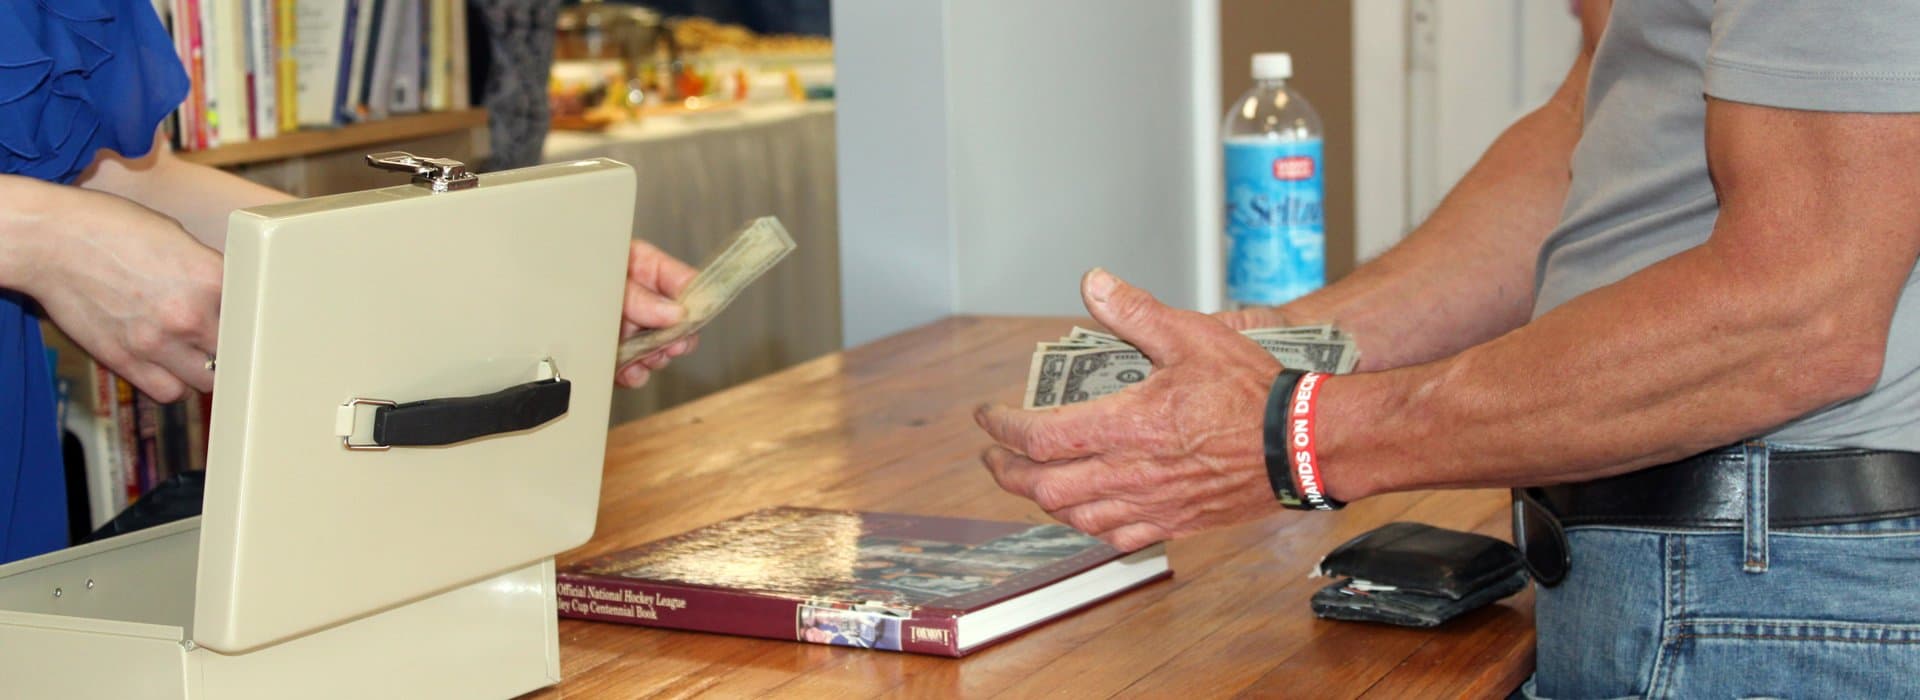 Small Business & Workforce$578.6M
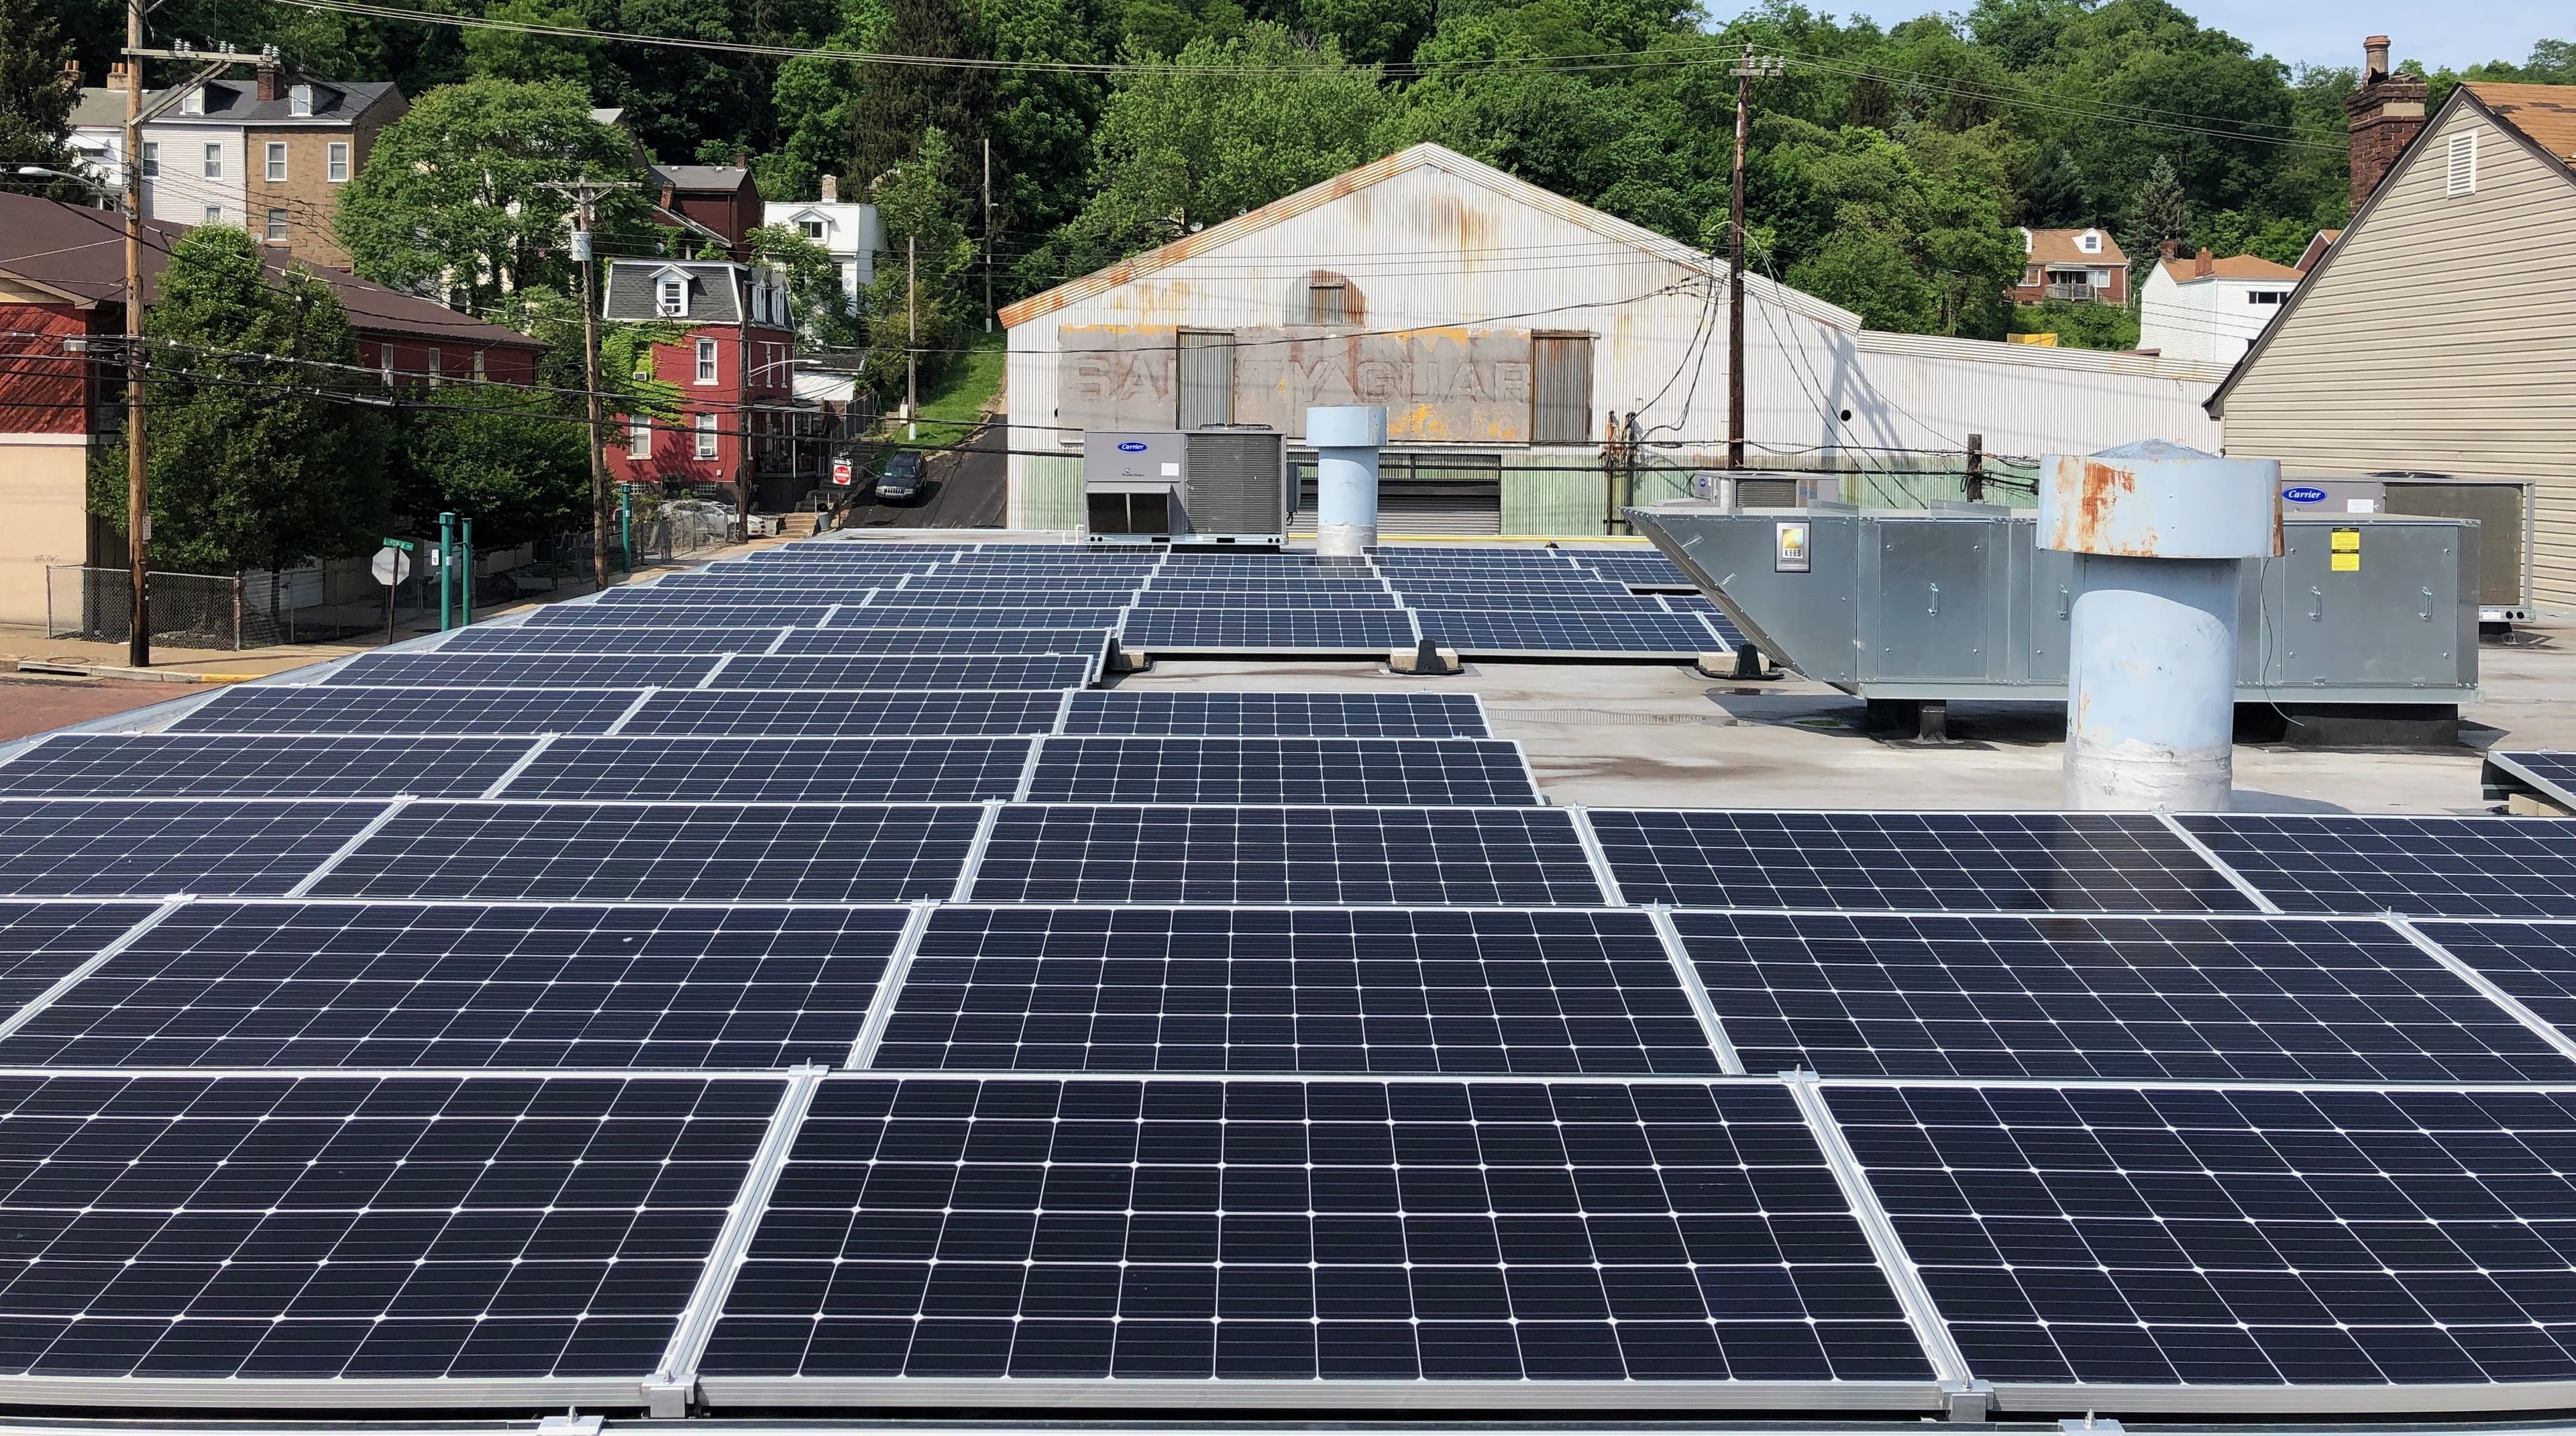 Energy$257.4M
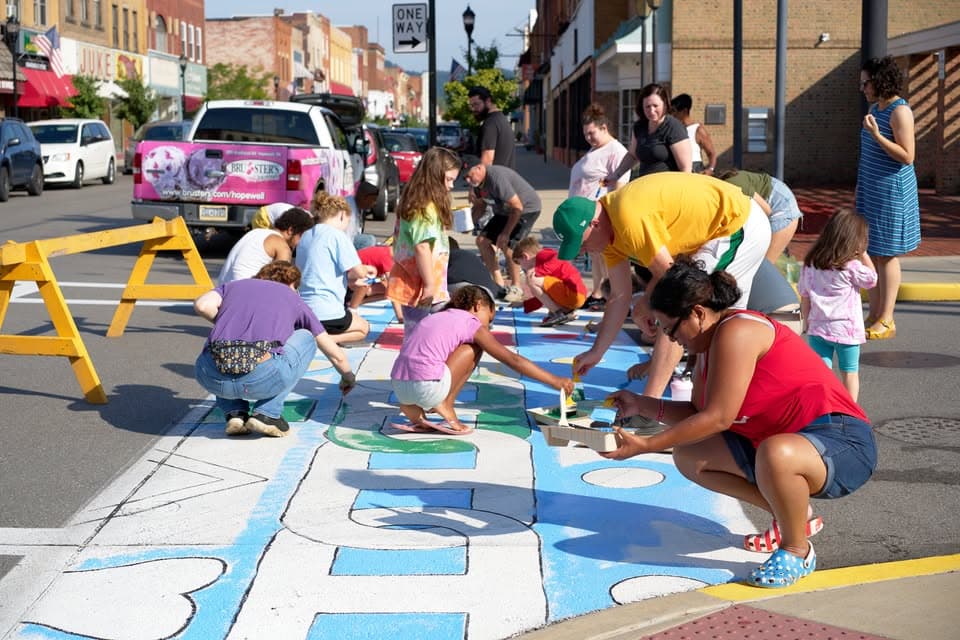 Creative Industries$164.0M
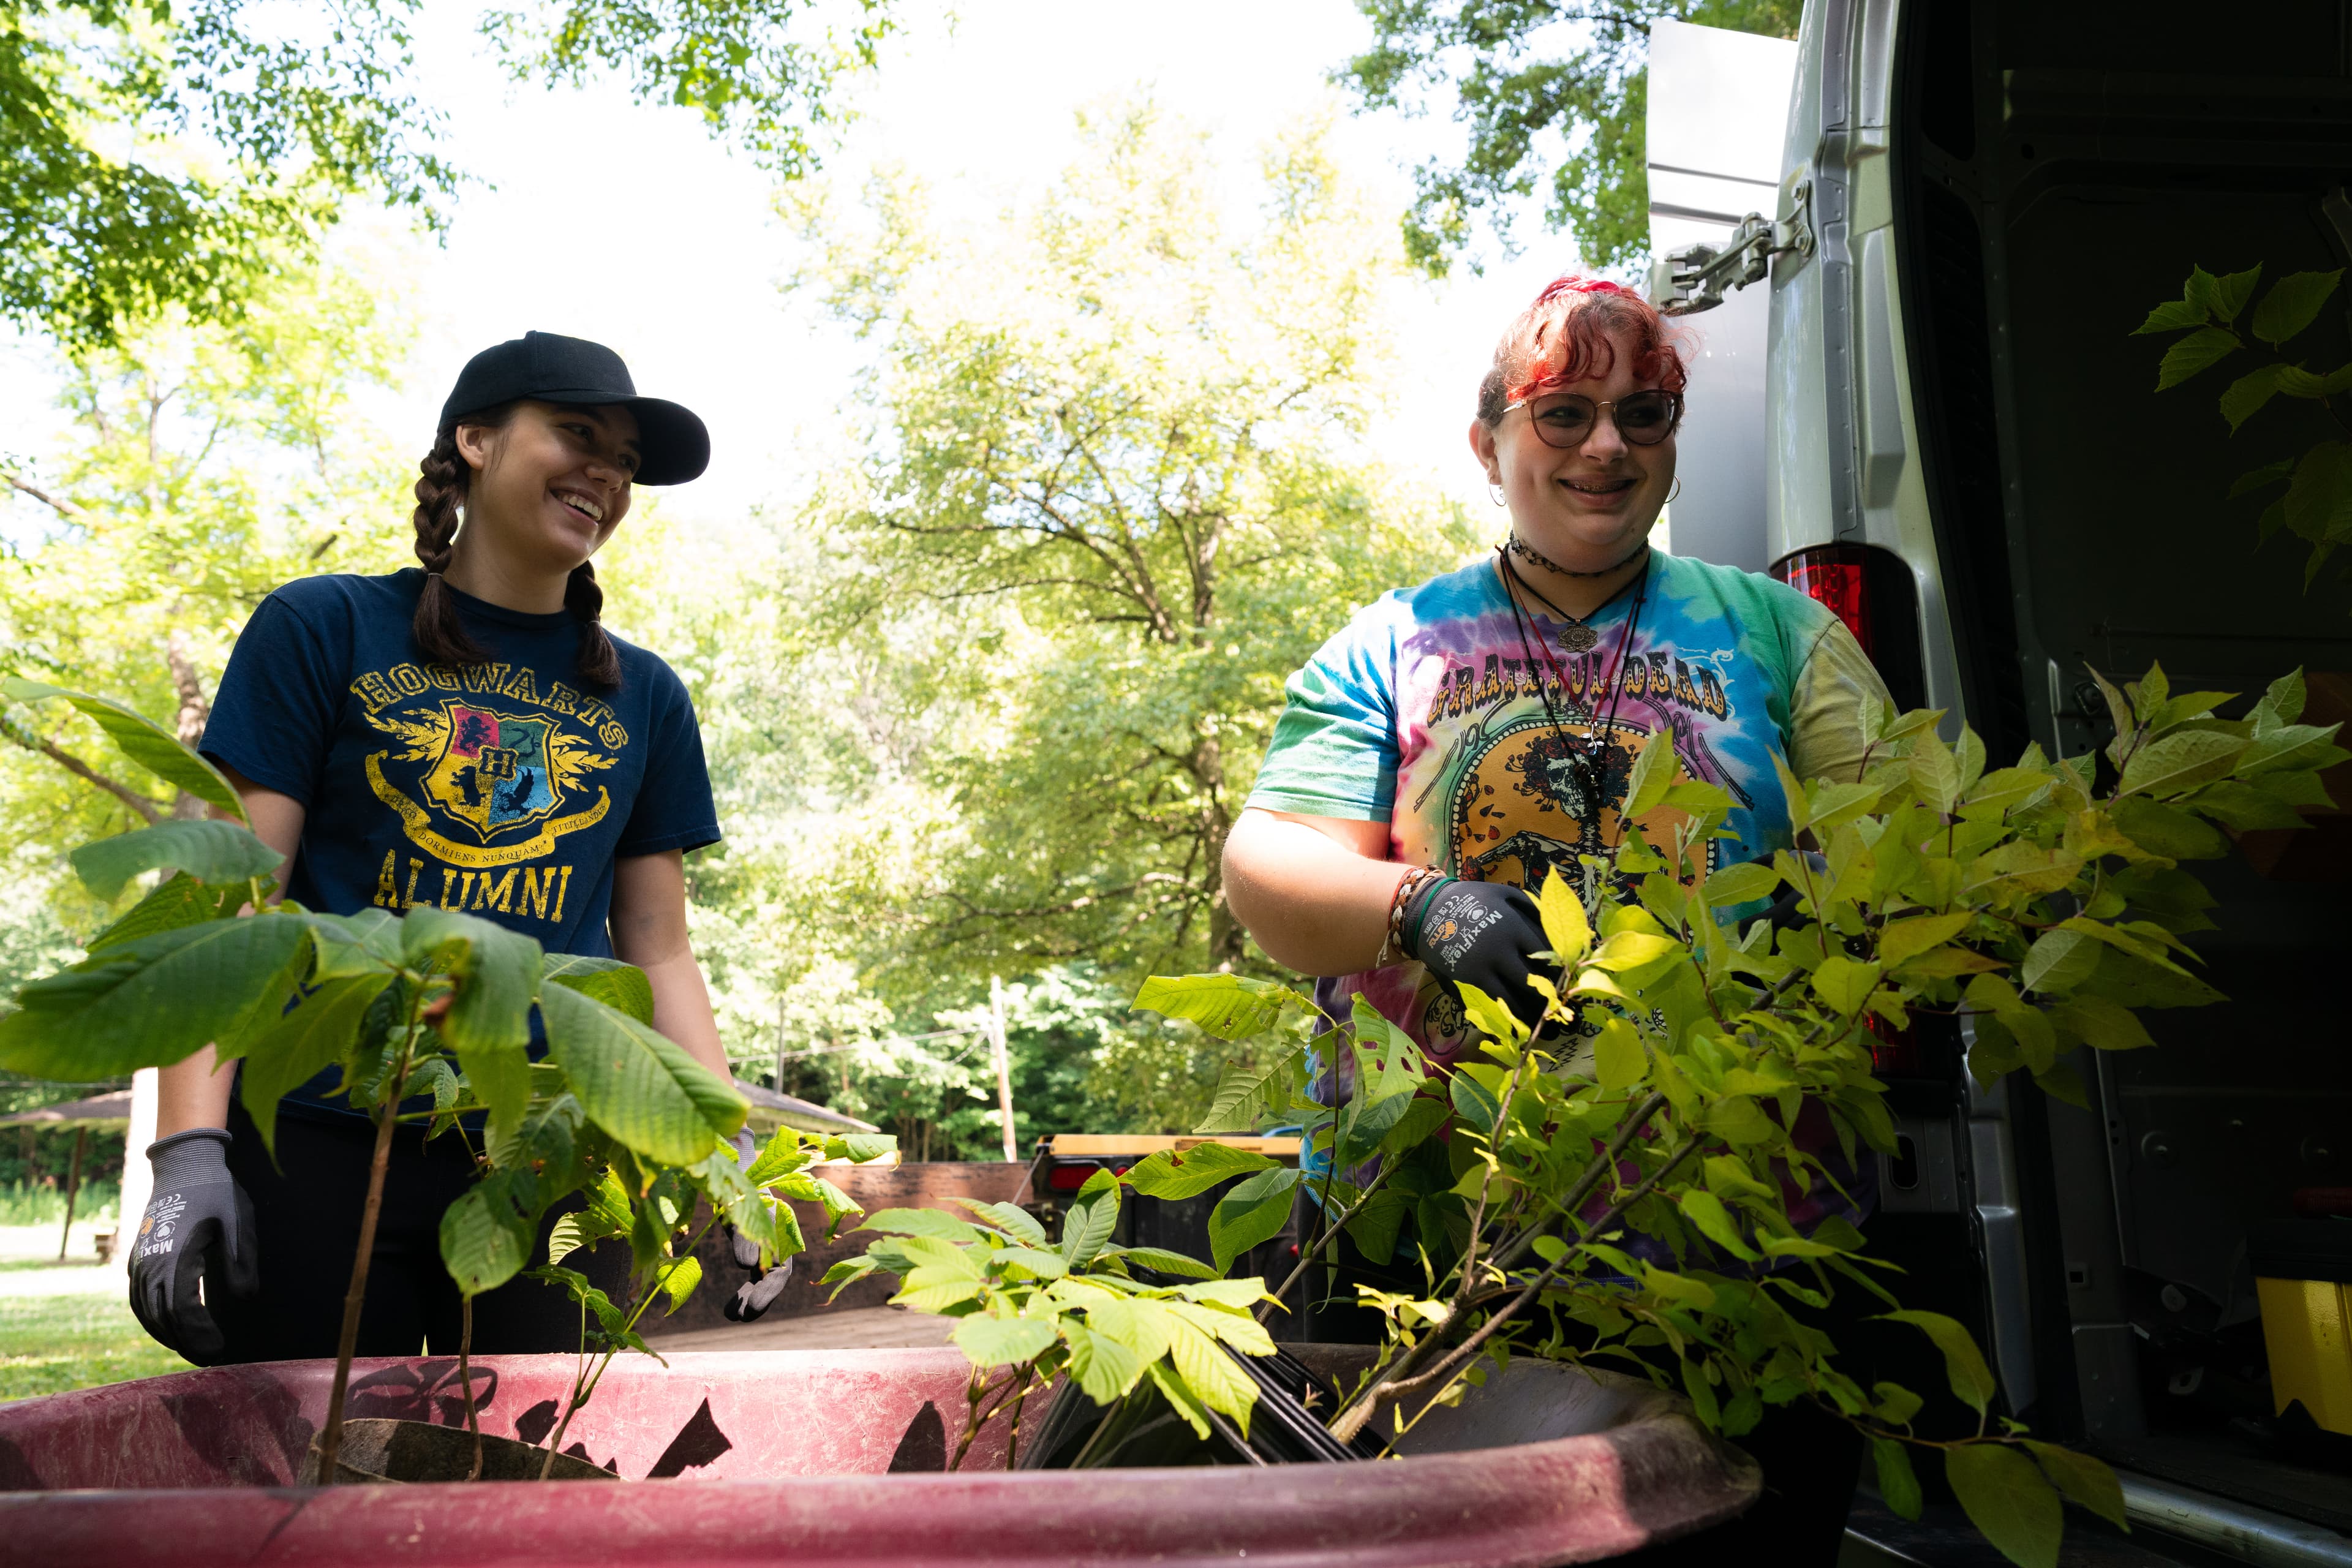 Food & Nature-based Infrastructure$151.9M
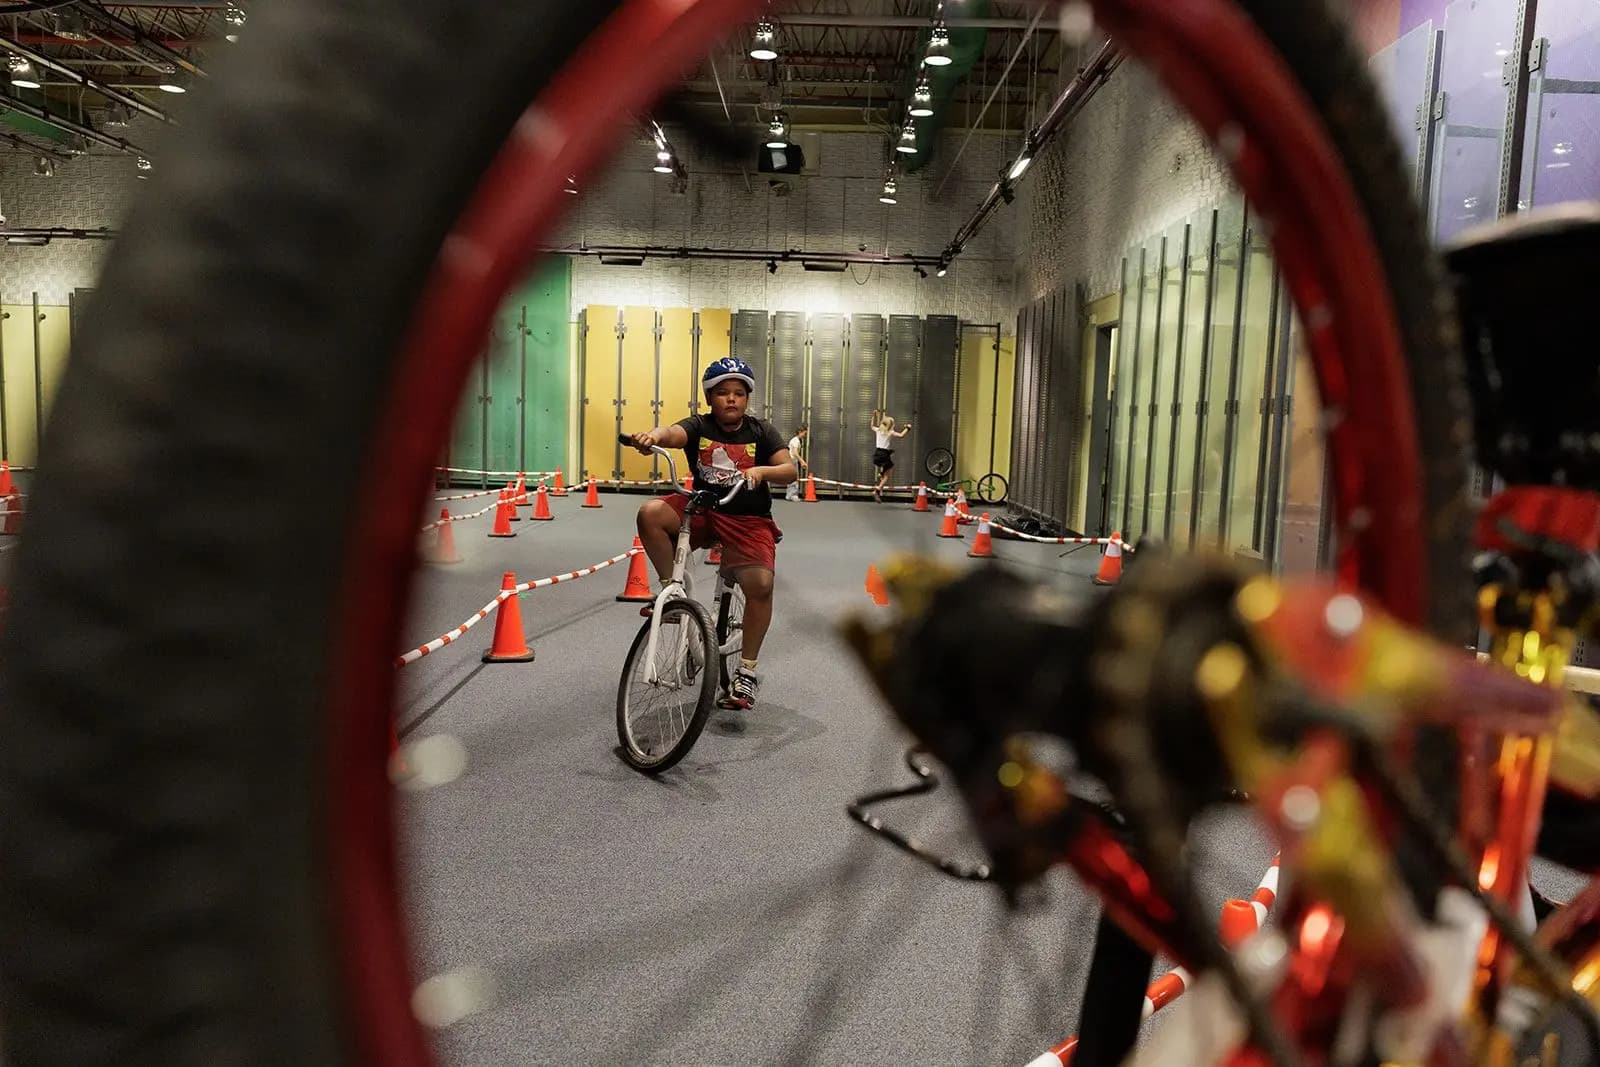 Active Mobility$21.6M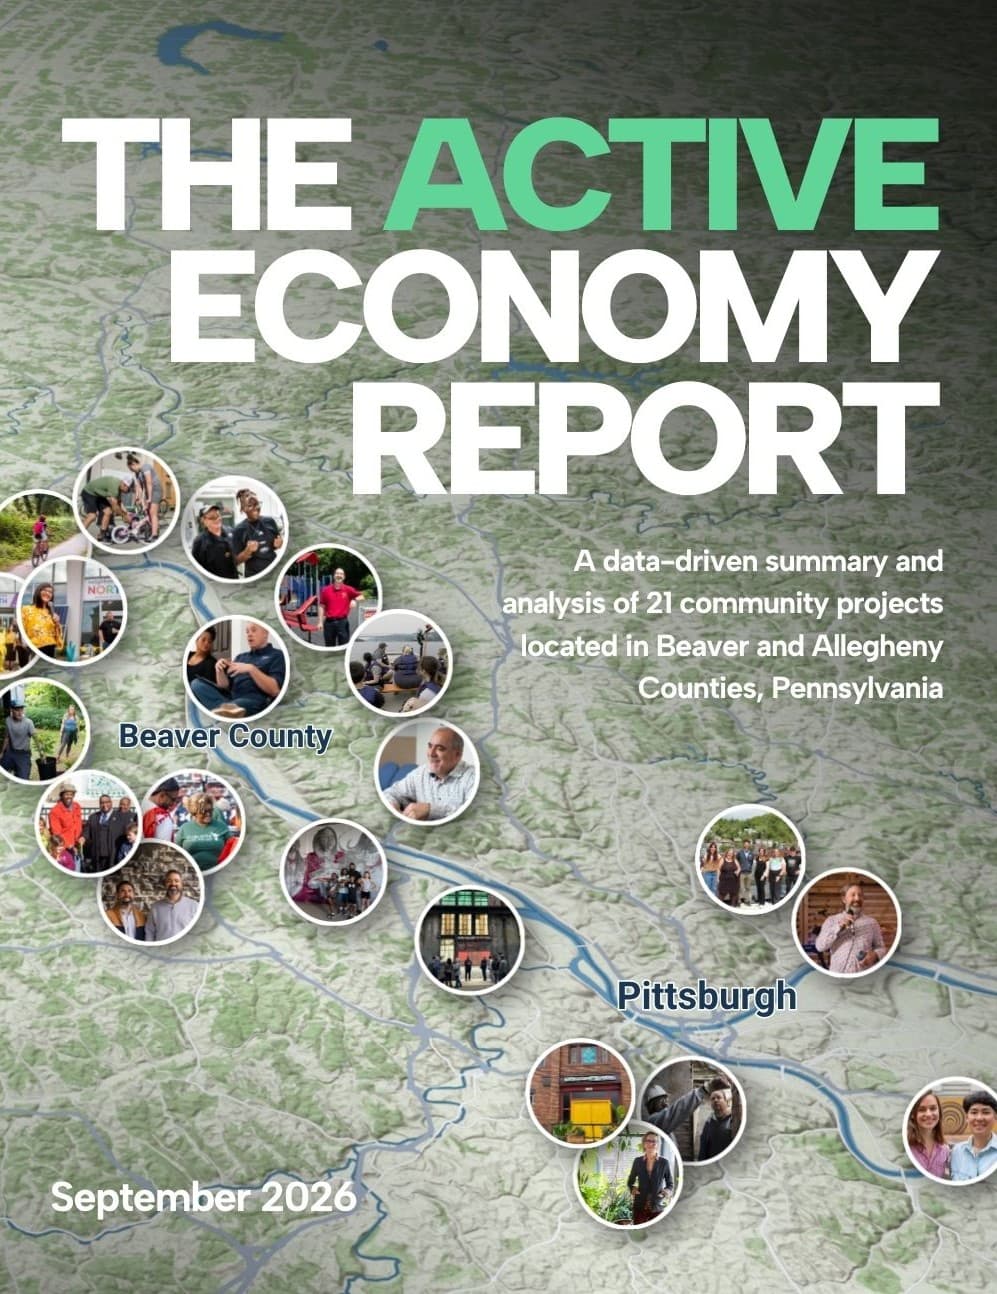
Jobs Sustained Over Time
The 21 projects in the Active Economy Portfolio are projected to sustain 574 permanent annual jobs at maturity, representing 6,640 job-years across the time period analyzed.
82 of those positions exist today. As projects in the portfolio move toward construction in the coming months, that number will continue to grow.
82 of those positions exist today. As projects in the portfolio move toward construction in the coming months, that number will continue to grow.
SROI Details
by Cluster
When considered beyond the bounds of traditional economic analysis, the benefits of the Active Economy become clearer yet. The figures here provide a partial snapshot of how researchers at UCSUR translated the activity of community projects into figures representing Social Return on Investment, organized across six sector clusters.
Real Estate Development
$83.0M
1 / 6
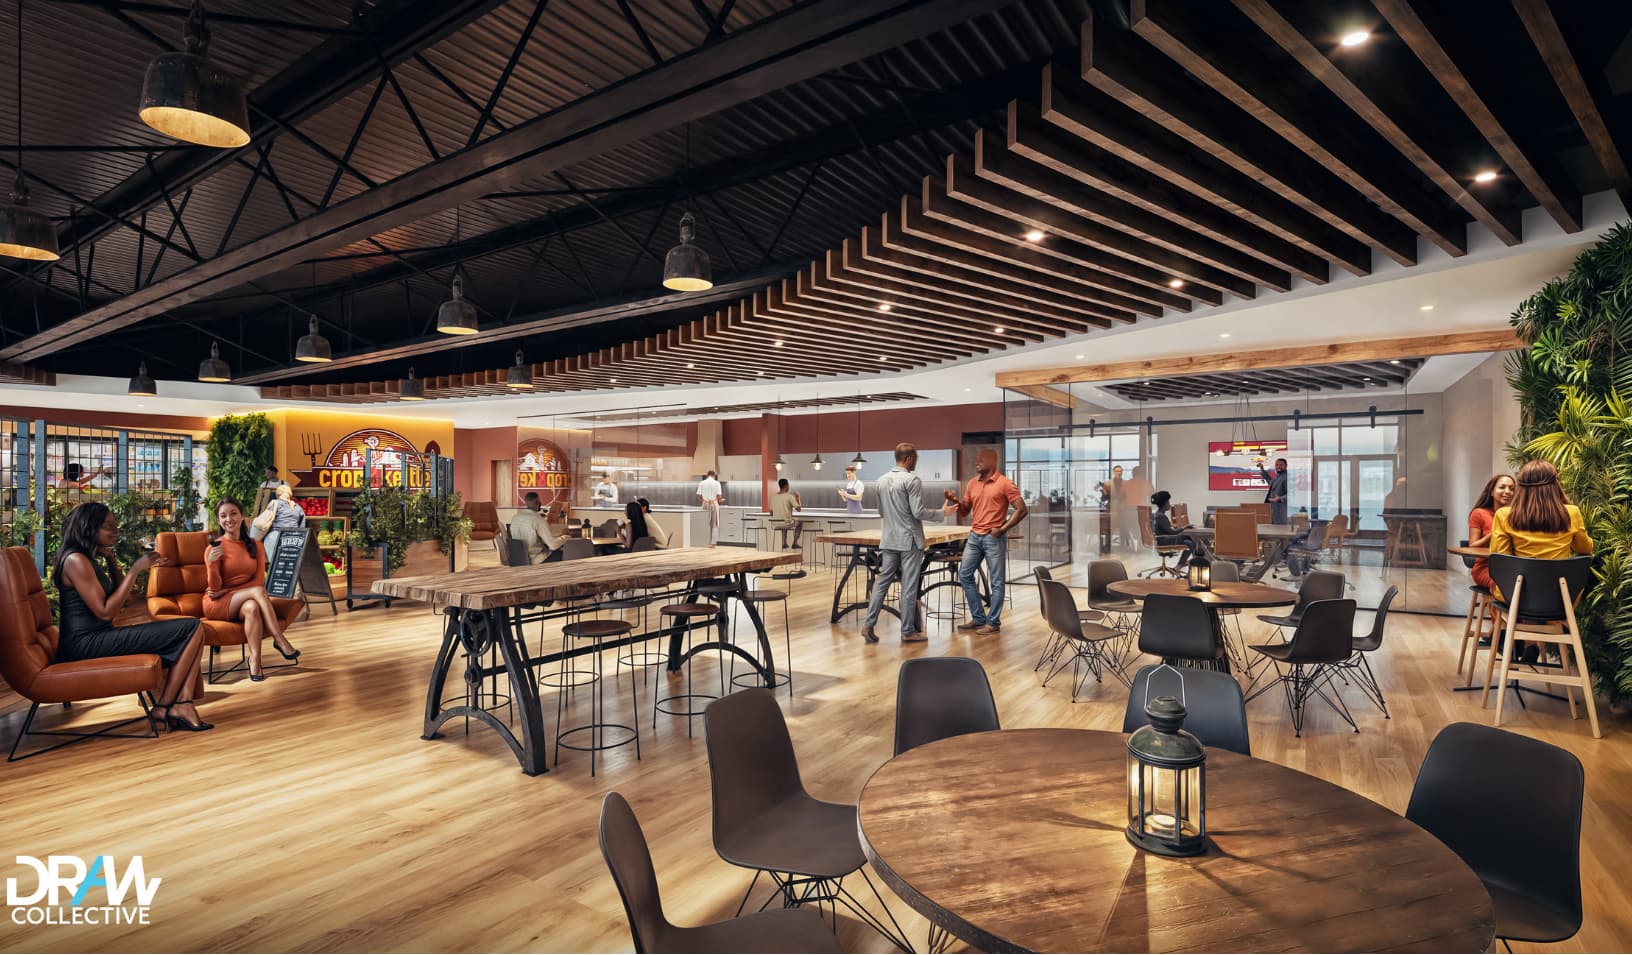
The social benefits generated by this cluster arrive principally through blight abatement and real estate recovery.
The cluster projects researched for this report are projected to produce $83 million in total social value over 20 years, including blight abatement, property appreciation, and other monetized activities.
Small Business & Workforce
$53.4M
2 / 6
The social benefits generated by this cluster arrive principally through increases in participants’ long-term earnings and the family stability such earnings make possible.
The cluster projects researched for this report are projected to produce $53.4 million in total social value over 20 years, including business incubation, workforce development, and other monetized activities.
Energy
$25.9M
3 / 6
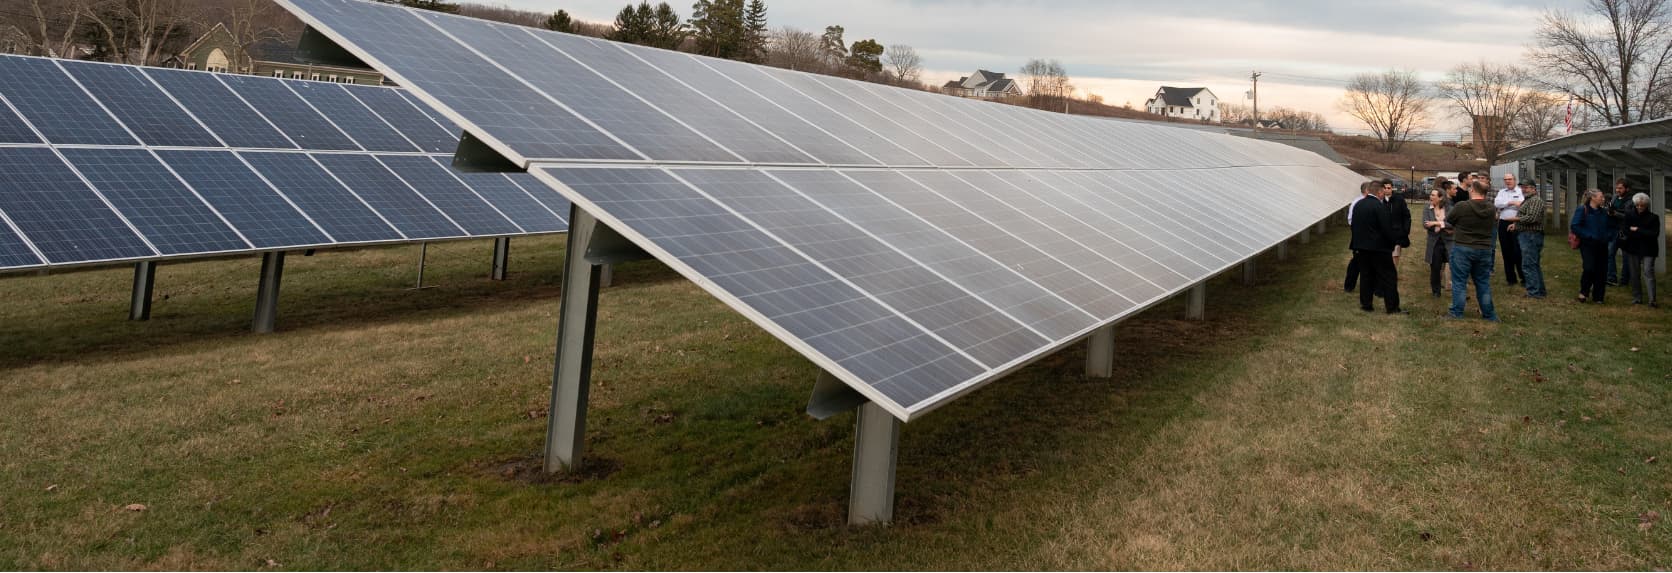
The social benefits generated by this cluster arrive through the collective offsetting of greenhouse gas emissions and the improvement of public health that follows from cleaner air.
The cluster projects researched for this report are projected to produce $25.9 million in total social value over 20 years, including 4,520 megawatt-hours of solar energy, 1,775 metric tons of CO2 avoided, and other monetized activities.
Food & Nature-Based Infrastructure
$18.8M
4 / 6
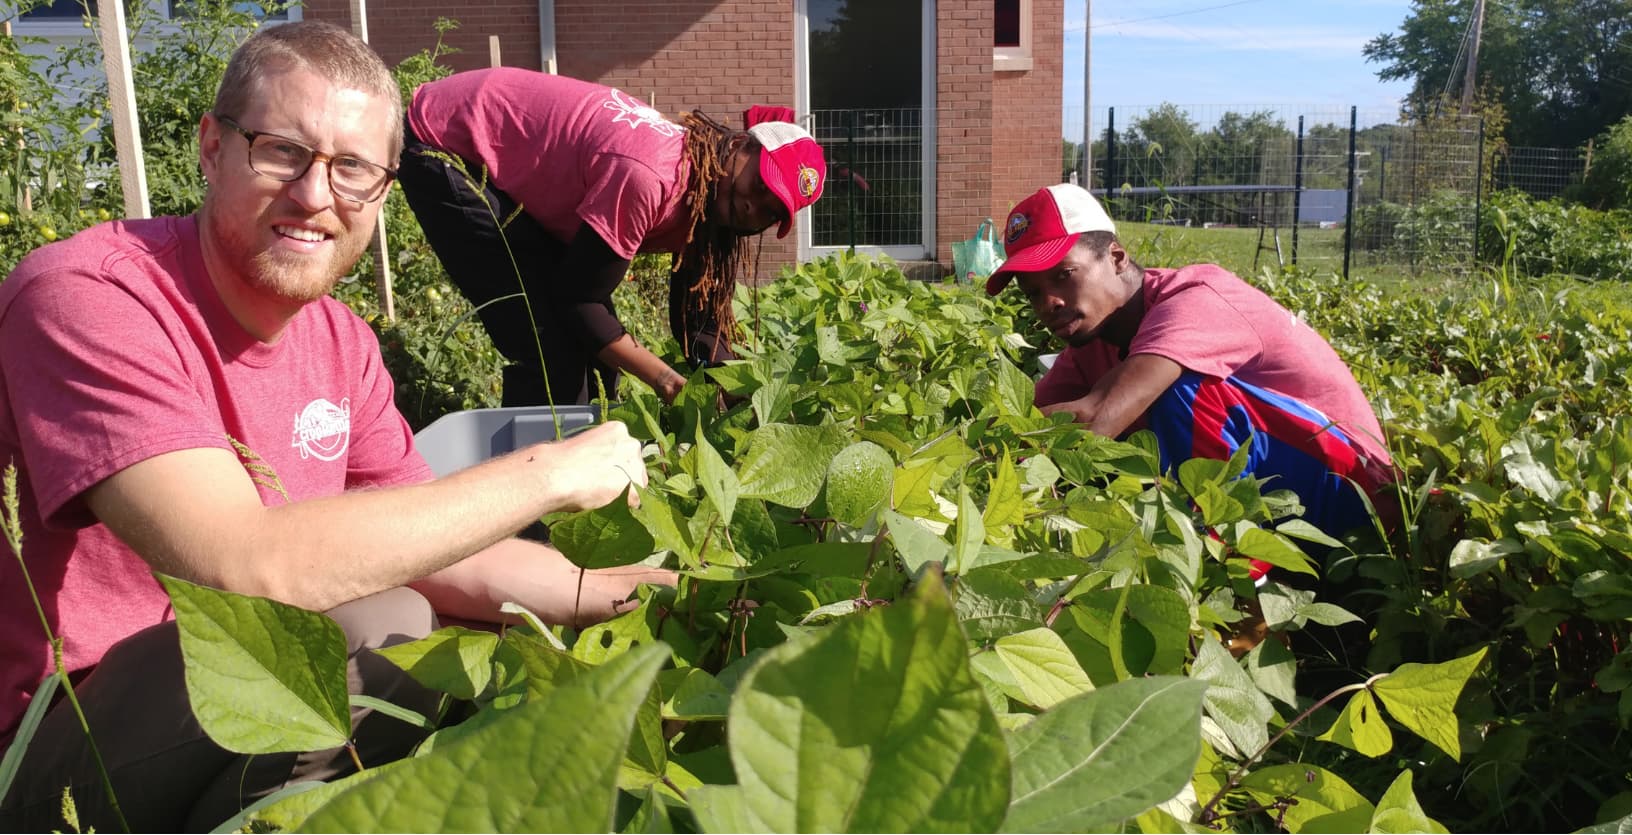
The social value generated by this cluster arrives principally through expanded food access and the public health costs such access averts.
The cluster projects researched for this report are projected to produce $18.8 million in total social value over 20 years through food distribution, nature-based infrastructure, and other monetized activities.

Creative Industries
$46.0M
5 / 6
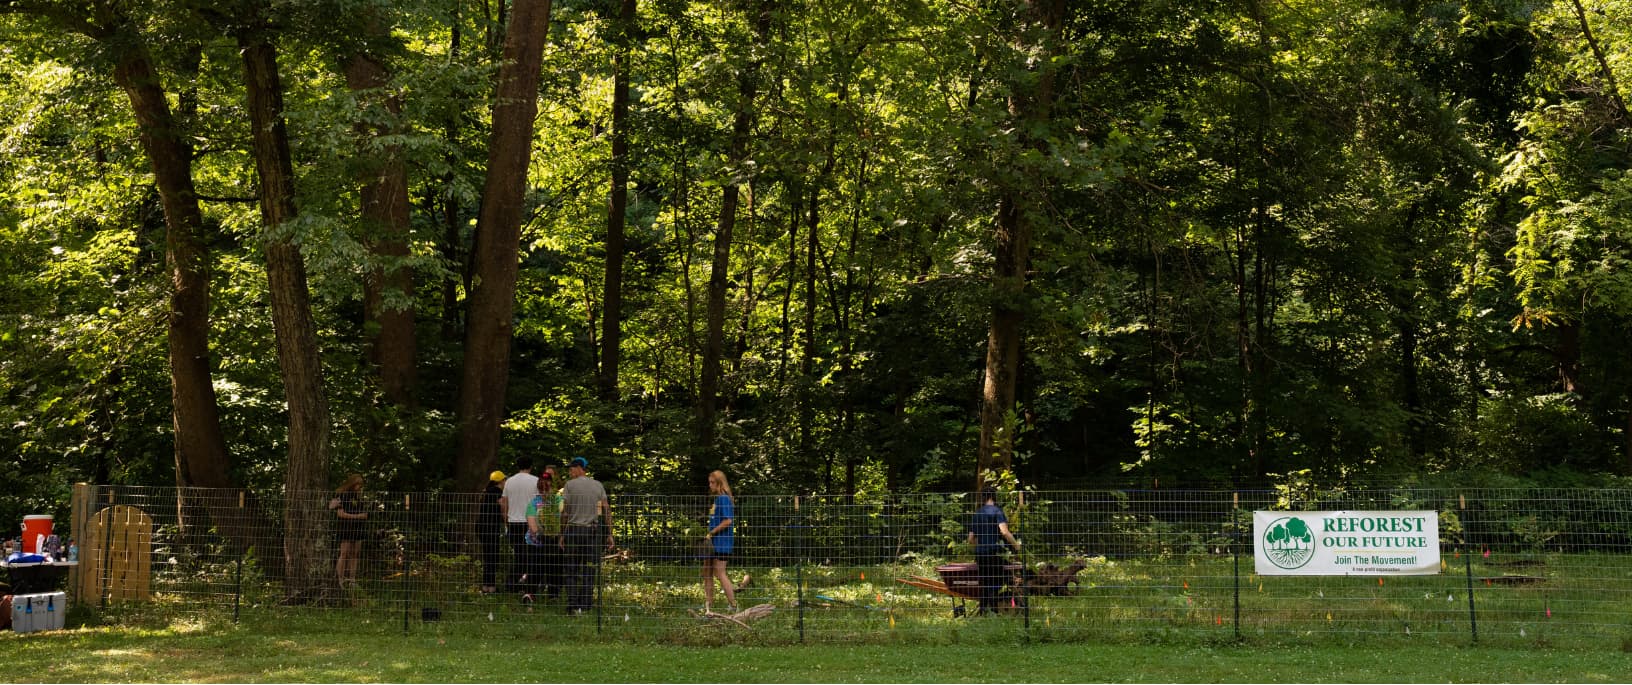
The social value generated by this cluster arrives through art and media production, community programming, and education.
The cluster projects researched for this report are projected to produce $46 million in total social value over 20 years through art and media production, community programs, education, and other monetized activities.
Active Mobility
$16.1M
6 / 6
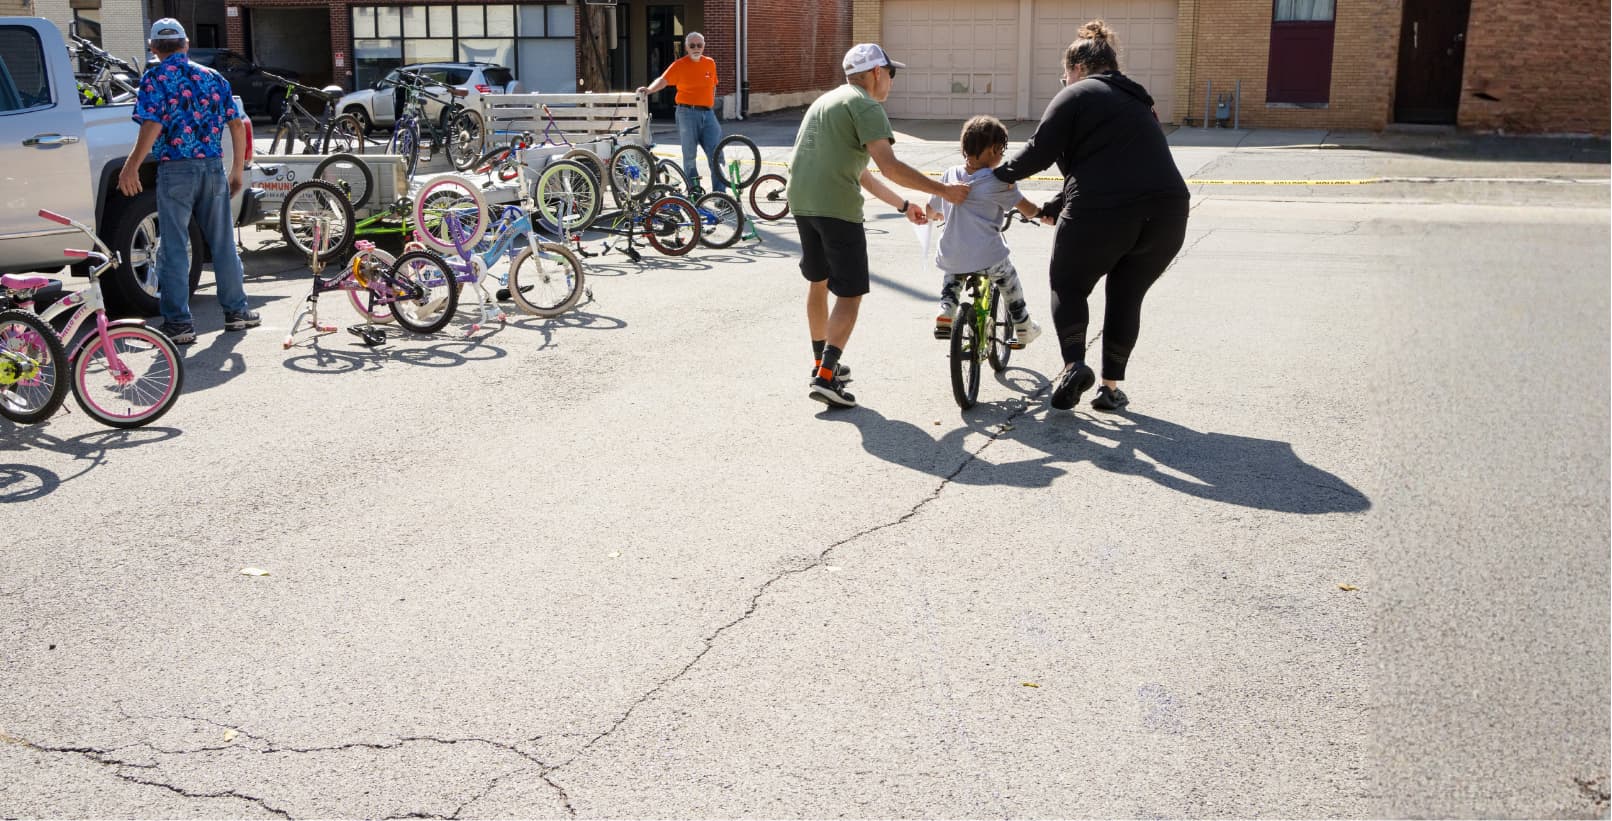
The social value generated by this cluster arrives through safety benefits, health impacts, transportation cost savings, and increased property values.
The cluster projects researched for this report are projected to produce $16.1 million in total social value over 20 years through safety, health, transportation access, property appreciation, and other monetized activities.
Social Value Across Eleven SROI Metrics
Social value in the Active Economy comes in many different forms. Here we highlight the cumulative value of the most common ways that projects in the portfolio produce a social return on investment (SROI).
$3.96M
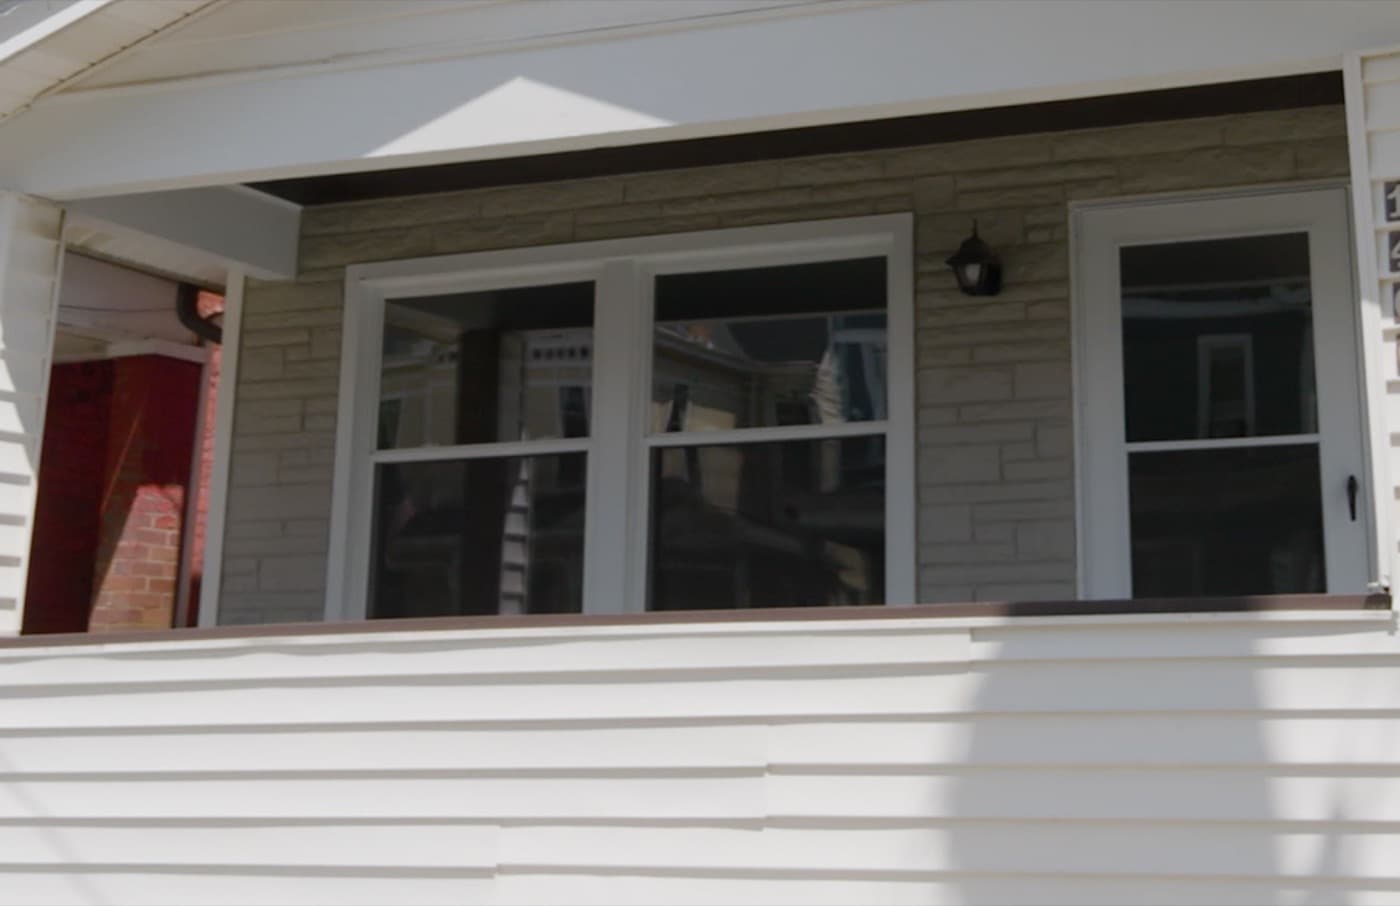
Value of Blight Abatement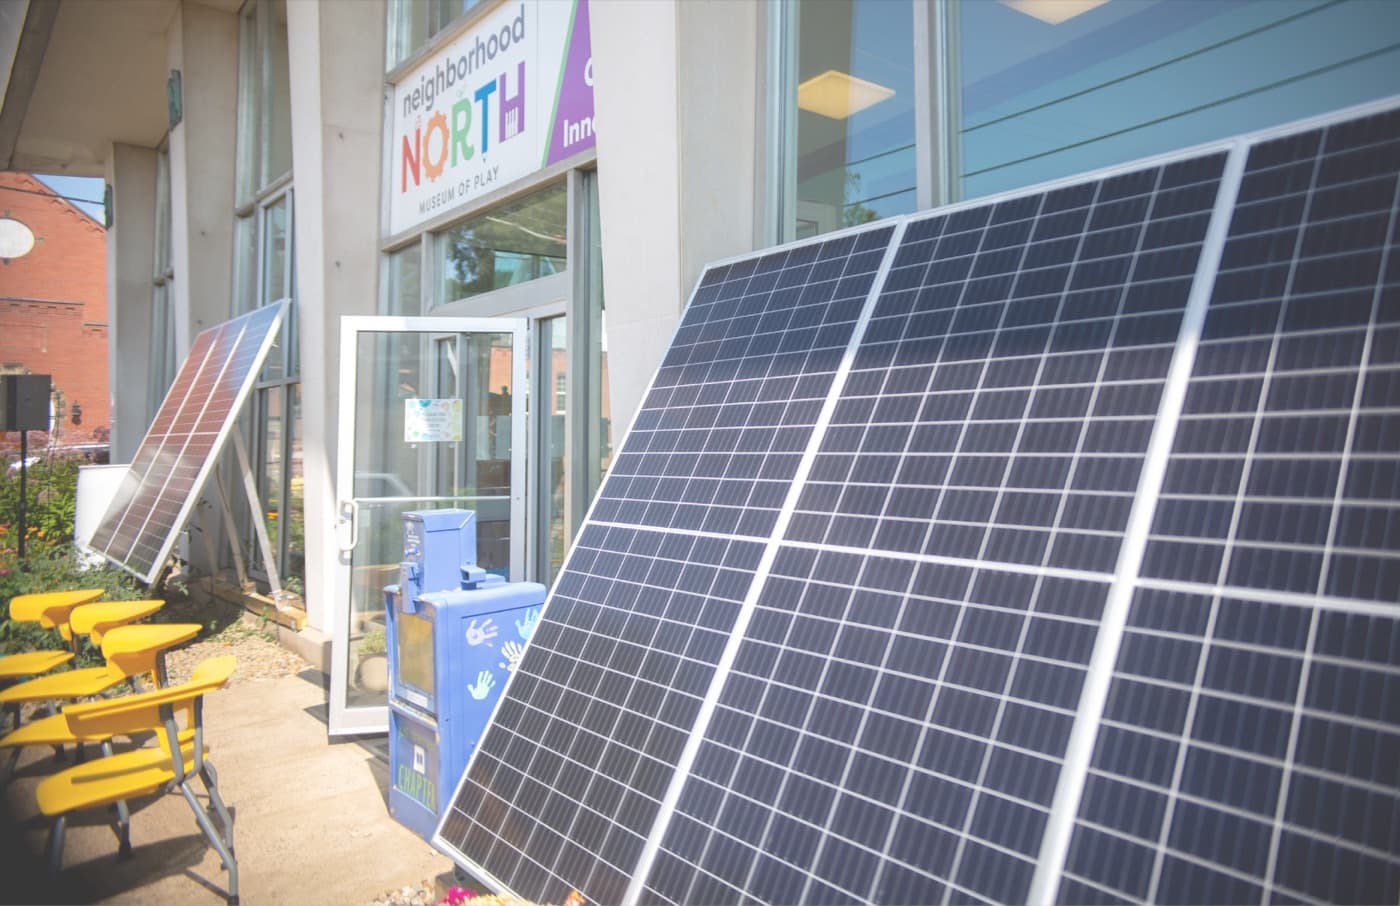
4.52MkWh
kWh of Renewable Electricity Produced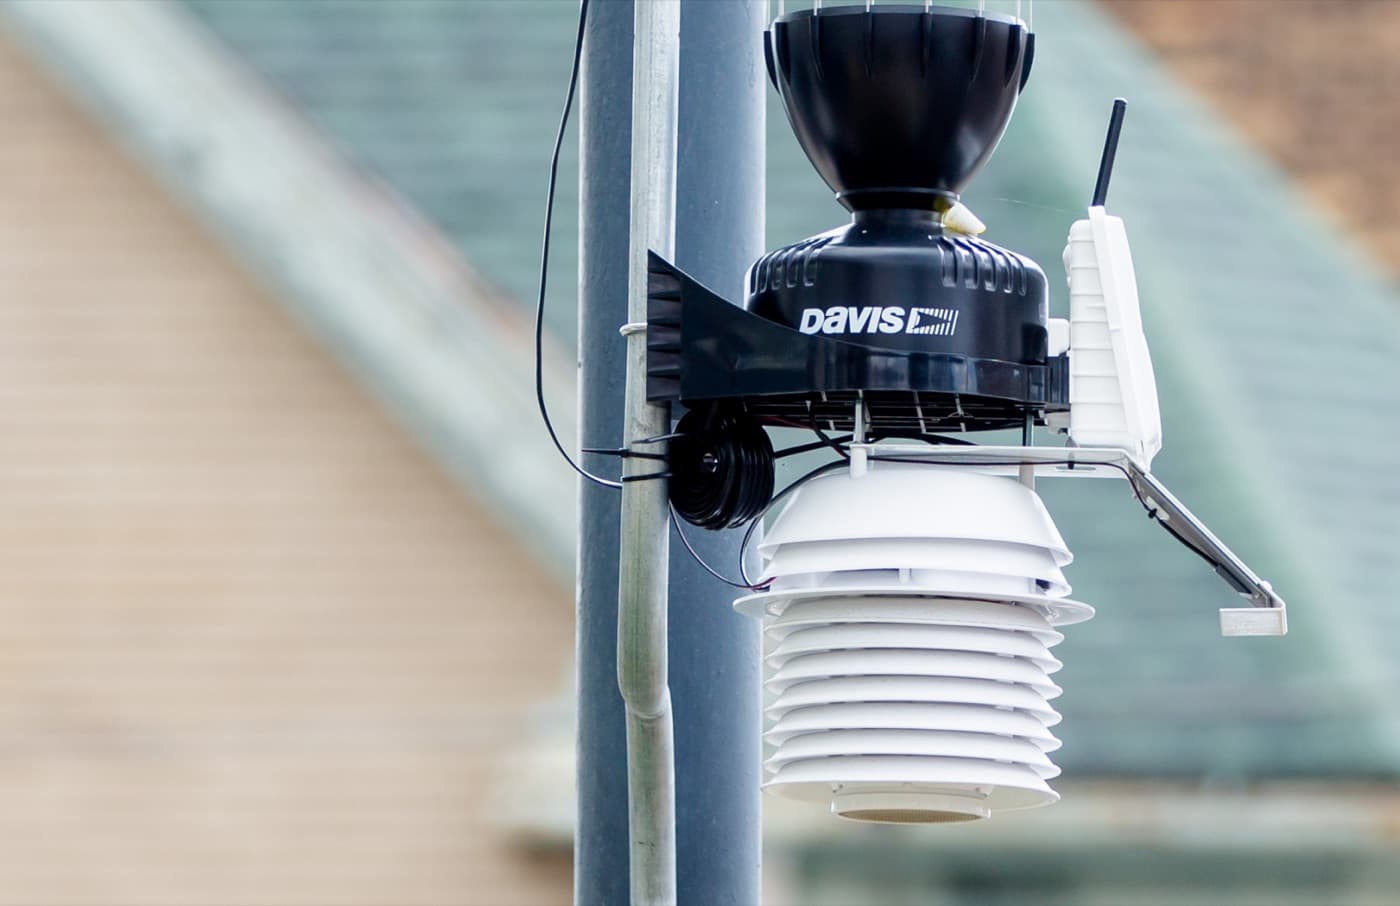
1,775t CO₂
CO₂ Emissions Avoided
$1.77M
Value of Art & Culture Produced
$24.48M
Value of Workforce Development Programs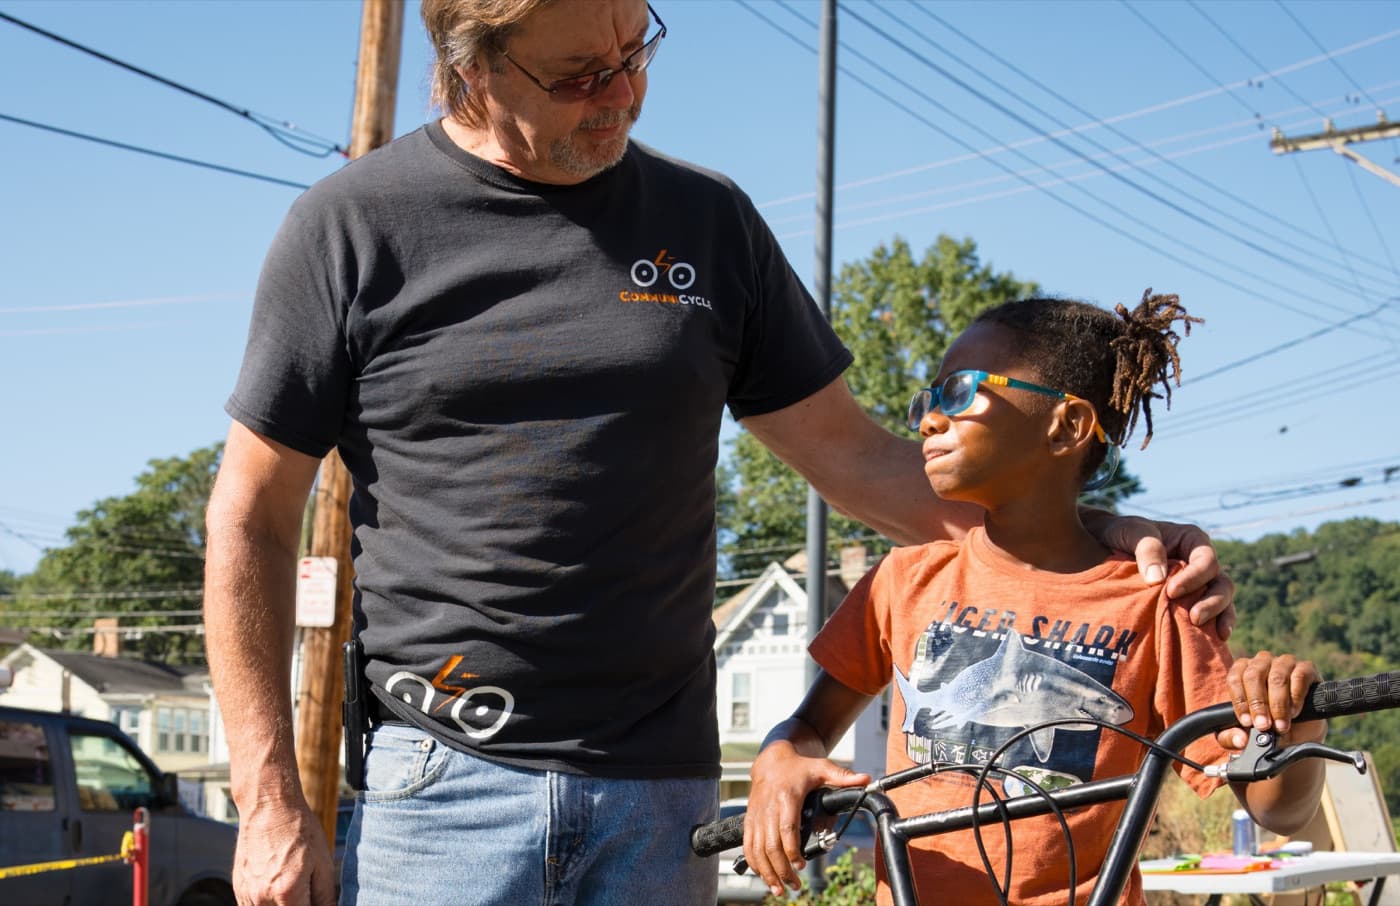
$6.41M
Value of Volunteer Hours Donated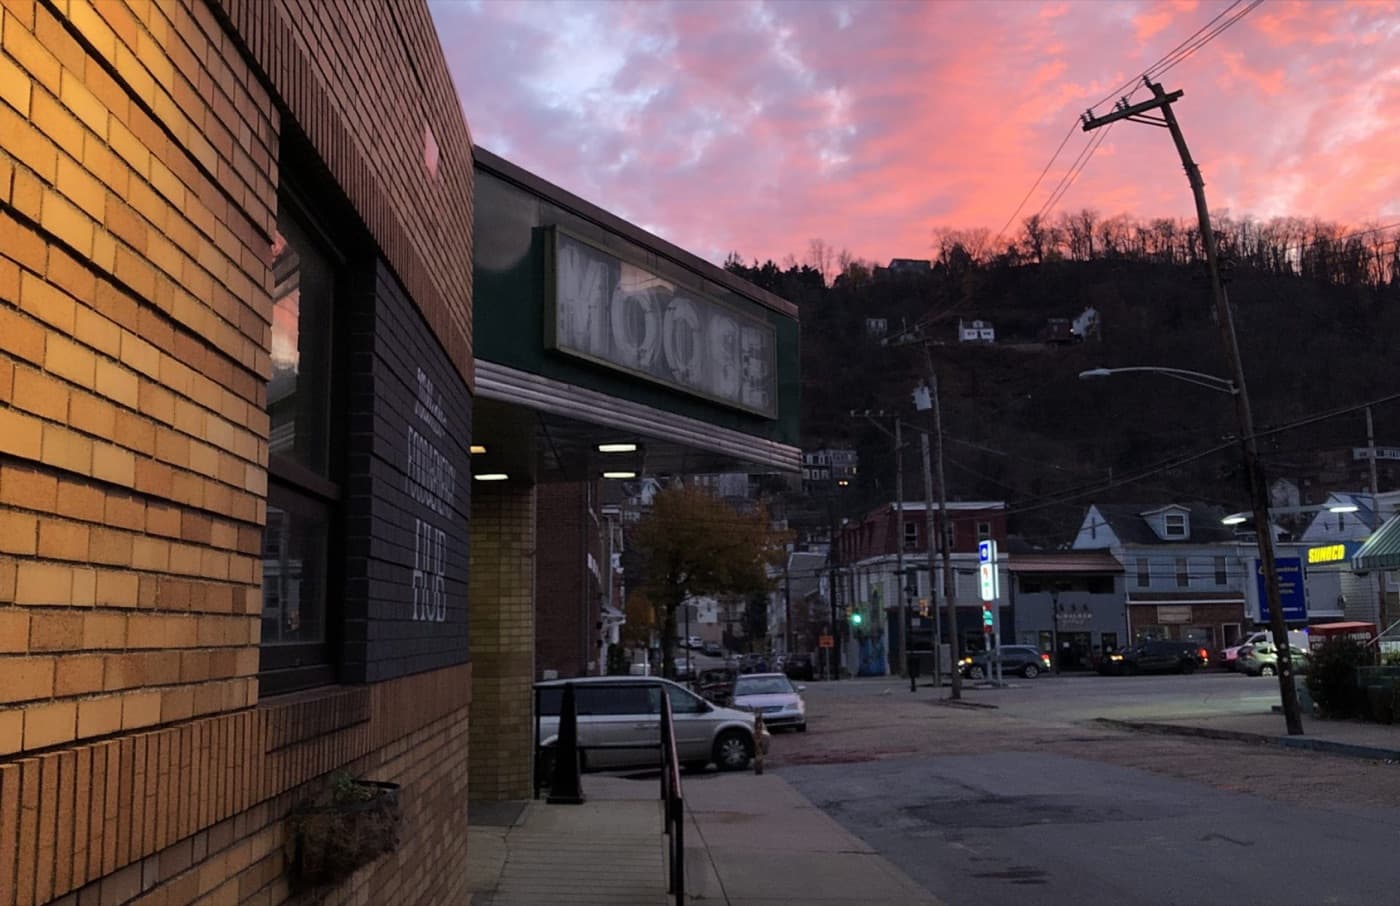
$8.99M
Value of Property Appreciation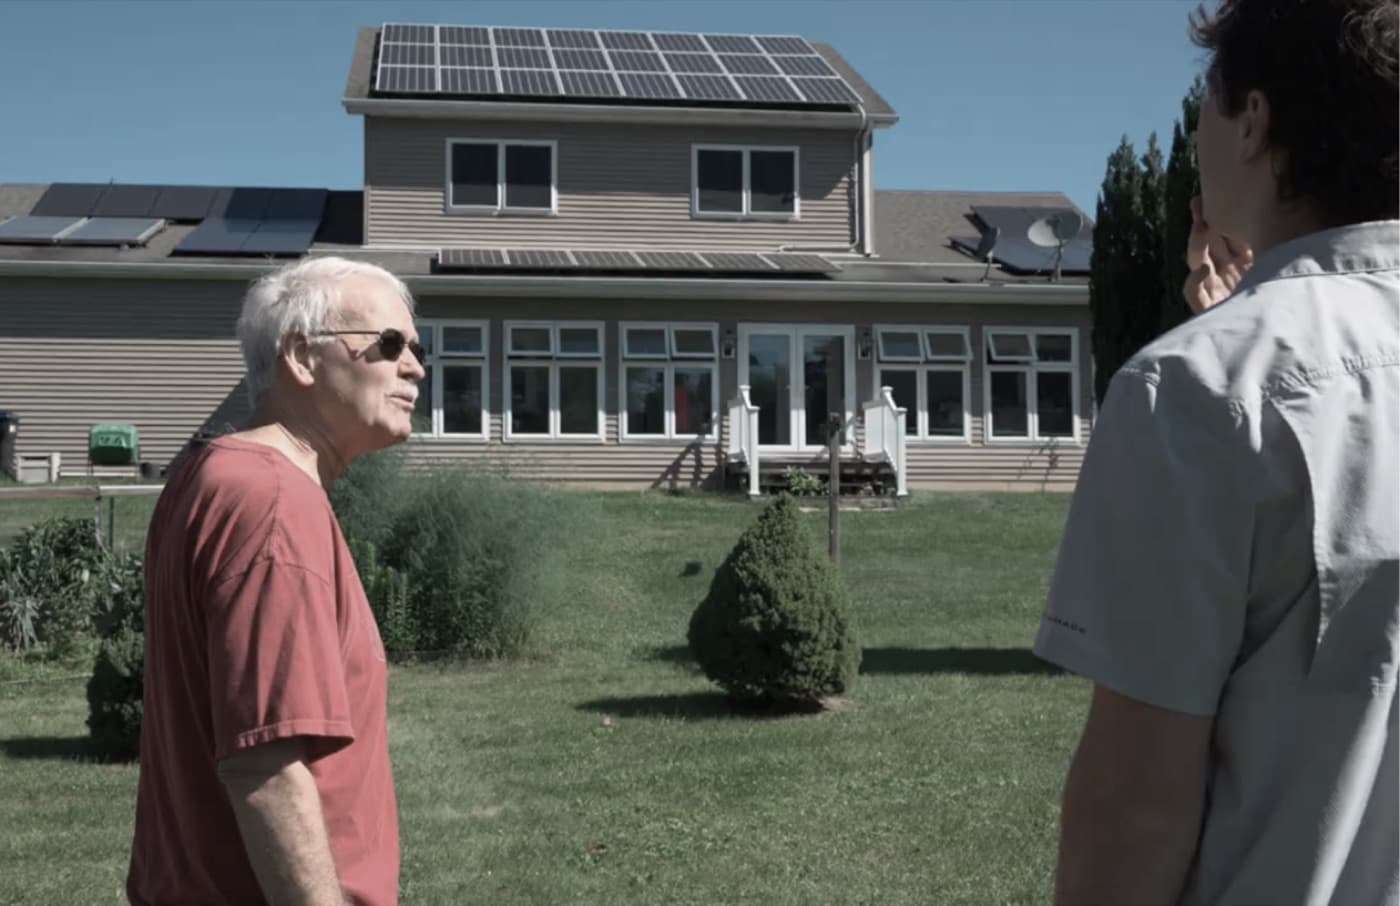
$1.24M
Savings from Renewable Energy & Efficiency Programs
$7.47M
Value of Produce Grown or Saved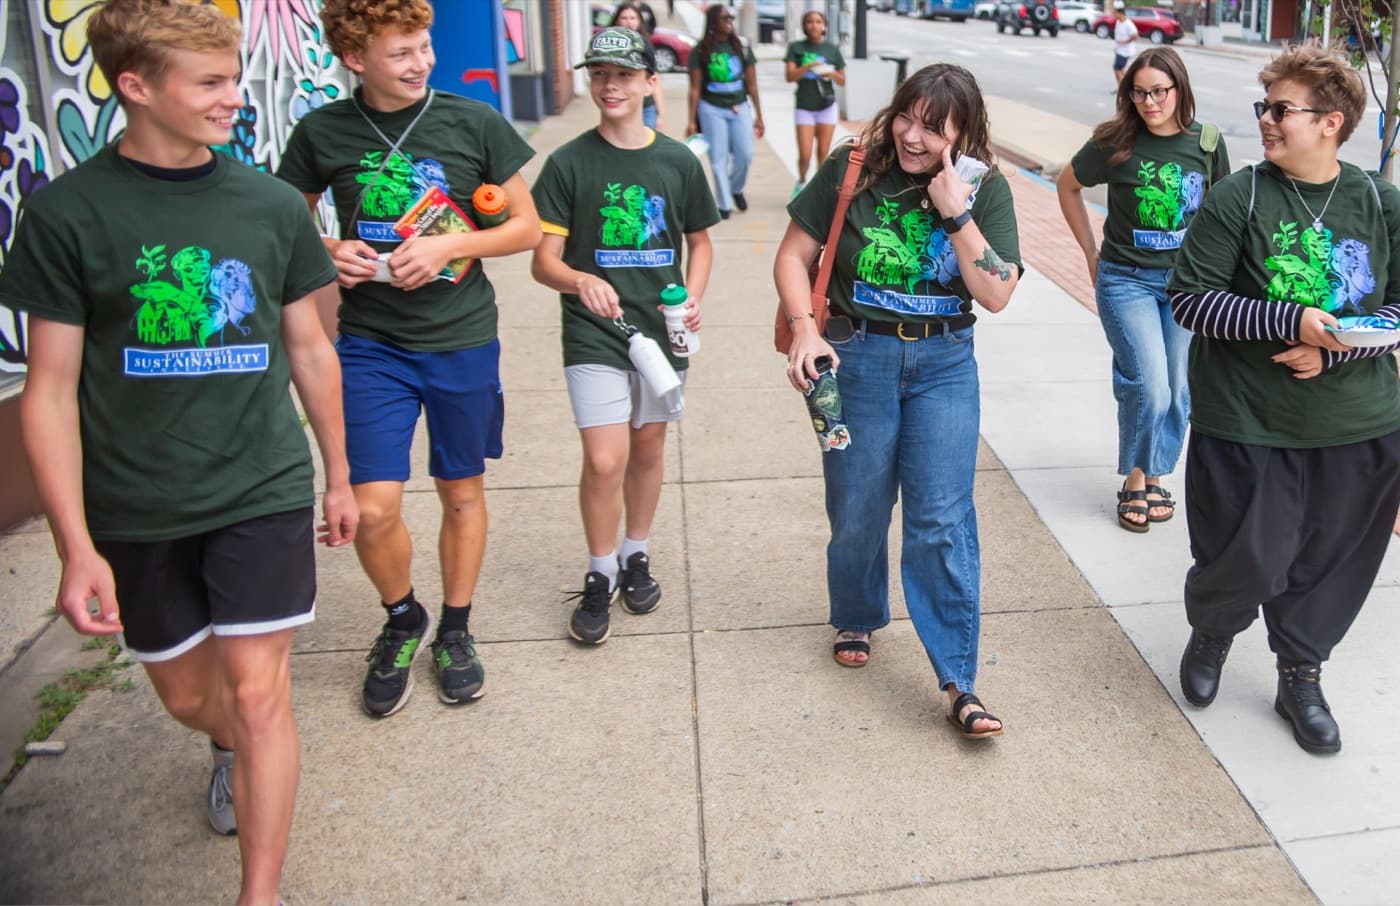
$15.93M
Value of Community Education + Programs
$37.46M
Value of Business Incubation ProgramsFor decades the region has deployed subsidies in hopes of buying what the Active Economy already produces more cheaply and more durably, while keeping more of those returns in the communities where they were made.
This is what the Active Economy is building — but so much more is possible…